Time Value of Money
Money received or paid at different time is like different currencies. You can’t add it. Money has a time unit. You must convert them to a common unit to aggregate. Typically we refer to time 0 as today on the time line. Get in the habit of placing cash flows on a time line. We need rate for time to convert them to a common time unit, and that exchange rate is called discount factor
(1 + R)twith t equals the number of time periods into the future or the past, and R is the rate of return offered by investment alternatives in the capital markets of equivalent risk. Riskier investments are met with higher returns. The values of future cash flows as of today are called present values. Compounding is moving the cash flow forward in time.
Useful shortcuts
CF = cash flow; R = discount rate; g = growth rate; assuming first cash flow arrives one period from today:
| Annuity | An annuity is finite stream of cash flows of identical magnitude and equal spacing in time. E.g.: savings vehicle, home mortgage, auto lease, bond payments. PV = CF * (1 - (1 + R)-T) / R= Cash Flow * Annuity Factor |
| Growing annuity | A growing annuity is a finite stream of cash flows that grow at a constant rate and that are evenly spaced through time. E.g.: income streams, saving strategies, project revenue/expense streams. PV = CF * (1 - [ (1 + R) / (1 + g) )]-T) / (R - g) |
| Perpetuity | A perpetuity is just like an annuity expect the cash flow goes on forever. E.g.: Perpetuity, consol bonds PV = CF / R |
| Growing perpetuity | A growing perpetuity is just like a growing annuity expect the cash flow goes on forever. E.g.: dividend streams. PV = CF / (R - g) |
Taxes
Taxes reduce returns on our investment. After-tax discount rate R’ shall be used.
R' = R * (1 - t)where R is discount rate; t is tax rate.
Inflation
Inflation can be important. Inflation is not going to affect the money we earn. Inflation will affect what we can buy with the money we are pulling out. Real discount rate is defined as below:
RR = (1 + R) / (1 + π) - 1where R is discount rate, RR is real discount rate, and π is the expected inflation, and inflation rate π is actually making real discount rate RR lower than nominal discount rate R.
Another commonly used approximation is simply:
RR = R - πTaxes affect dollars, but inflation affects consumption. It means, in order to keep the same purchasing power in the future, we need to save more money today (more present value). Remember we discount nominal cash flow by nominal discount rate to get the price, which is equal to real cash flow discounted by real discount rate.
Interest Rate
When you look at savings vehicles (for example: Jumbo Certificate of Deposits), there are two different rates: APY and Rate.
| Rate = APR = Annual Percentage Rate | APY = Annual percentage Yield = EAR = Effective Annual Rate |
| Measures amount of “simple interest” earned in a year Simple interest = interest earned without compounding, and ignore the compounding frequency Many banks quote interest rate in terms of APR APR is not we usually earn or pay | Measures actual amount of interest earned or payed in a year This is what we care about. |
| APR is a quoting convention. Use APR in conjunction with compounding frequency to get at an EAR or at a periodic discount rate. | EAR is discount rate |
The relation between EAR and APR is:
Periodic Discount Rate i = APR / k
EAR = ( APR / k + 1 ) ^ k - 1

N = k * T
( 1 + EAR ) ^ T = ( 1 + i ) ^ N
where k is the number of compounding periods per year, T is number of years, N is number of periods.
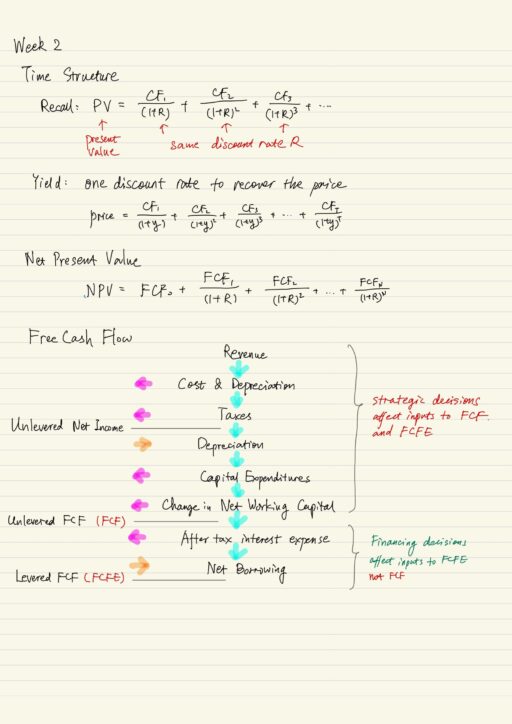
Time Structure
Interest rate and discount rate can vary over time and that could be captured via time structure of interest rate and yield curve. In reality, the interest rate varies with the term of the investment. The term structure is the relation between the investment term and the interest rate. A yield (y) is the one discount rate that when applied to the promised cash flows of the security recover the price of the security.
To build yield curve, simply compute the yield for securities of different maturities. The slope of yield curve reflects expectations of future interest rates. When yield curve is upward sloping, it suggests that future interest rates are likely to be higher. Treasury Yield Curves graph the relation between interest rate on risk-free loans and loan maturity.
We can plot yield curves for a host of different securities, and yields vary by maturities and risk. The better credit rating (safer), the lower yield. All of these interest rates are referred to as spot rate (for a loan made today).
Discounted Cash Flow
Valuation methods and decision criteria often used by CFOs in different industries:
| Non-financial | Financial | Private Equity |
| – Internal rate of return – Net present value – Payback – Discounted payback | – Discounted Cash Flows – Transaction multiples – Transaction premia – Public firm multiples | Vast majority relies on – Internal rate of return |
Net Present Value
NPV actually is just discounted cash flows. Accept all projects with a positive NPV and reject all projects with a negative NPV.
NPV = PV(benefits) - PV(cost) = Discounted Free Cash Flow
So there are mainly two components we need to discuss: Free Cash Flow and Discount Rate.
Free Cash Flow
Free cash flow is residual cash flow left over after “all of the project’s requirements have been satisfied” and “implications accounted for”.
FCF = (Revenue - Costs - Depreciation) * (1 - Marginal Tax Rate)
+ Depreciation - Capital Expenditures - Change in Net Working Capital

NWC = Current Assets - Current Liabilities
= Cash + Account Receivable + Inventory - Account Payable
FCF is the cash flow that can be distributed to the financial claimants (e.g., debt and equity) of the project or company. It is NOT the same as accounting cash flow from the Statement of Cash Flow (SCF) but we can derive FCF from the SCF.FCF = Unlevered Free Cash Flow, don’t be confused with Free cash flow to equity (FCFE) or Levered free cash flow.
Free Cash Flow to Equity (FCFE)
Free cash flow to equity is residual cash flow left over after “all of the project’s requirements have been satisfied”, “implications accounted for” and “all debt financing has been satisfied”:
FCFE = FCF - Interest * (1 - Marginal Tax Rate) + Net BorrowingFCFE is the cash flow that can be distributed to shareholders (i.e., equity) of the project and company.
FCFE = Levered Free Cash Flow, because it is affected by the choice of leverage (i.e., debt).
Forecast Driver
Forecast drivers are the assumptions required to forecast each component of the free cash flow formula out into the future. The point of DCF is to focus discussion and analysis on relevant issues. DCF provides a rigorous framework within which we can discuss what really matters for value creation.
The goal of a DCF is not to get one number that we argue is correct, instead it is actually to provide a host of numbers and a host of sensible and financially correct information from which we can make better decisions. Successful valuation (decision making) depends critically on input from non-finance personnel.
| Revenue | Market size * Market share * Price |
| Costs | Cost margin * Revenue |
| Capital expenditures | Initial and future investment, liquidation value |
| Depreciation | Non-cash expense. It is not costing anything, but provide tax shield. |
| Change of Net working capital | Net working capital (t) – Net working capital (t-1) |
| Taxes | Marginal tax rate (MTR) = Tax rate on additional $ of earnings. Don’t be confused with the Effective tax rate ( Tax / Pre-tax Income ) |
After laying out all forecast drivers, we could use those assumptions to generate the free cash flow forecast, i.e., translating the forecast drivers into dollar forecasts.
Other free cash flow considerations
- Opportunity costs (alternative uses of resources).
- Project externalities (cannibalization, spillovers).
- Sunk costs (ignore).
- Other non-cash items (e.g., amortization, stock-based compensation, stock grants).
- Salvage values (assets do not disappear).
- Execution risk (idiosyncratic).
- Cash flow frequency (project dependent).
Decision Criteria
Once we have gotten Free cash flow, we can:
| Net present value using discount rate | The firm value (debt + equity) will increase by the number of NPV in expectation. If NPV > 0, then undertake the project. |
| Internal rate of return | The IRR of a project is the one discount rate such that the net present value of the project’s free cash flows equals zero.NPV = Price - PV(FCF's) = 0If IRR > hurdle rate (cost of capital), then undertake the project. |
| Payback period | The payback period (pp) of a project is the duration until the cumulative free cash flows turn positive. If pp < a threshold, then undertake the project. Shortcoming: 1. it ignores time value of money and risk of cash flows. |
| Discounted payback period | The discount payback period (dpp) of a project is the duration until the cumulative discounted free cash flows turn positive. If dpp < a threshold, then undertake the project. Shortcoming: 1. it ignores cash flows after cutoff leading to myopic decision making. 2. It does not tell us value implications of our decision. 3. it is not helpful in choosing among projects with similar payback periods. |
Sensitivity Analysis
No DCF is complete without a sensitivity analysis. It is really an integral component of any evaluation. It helps us identify where value is created or destroyed. Having setup our DCF, sensitivity analysis is used to check how robust and sensitive our valuation is, so we can make the most informed decision possible.
| Break even analysis | finds the parameter value that sets the NPV of the project equal to zero holding fixed all other parameters (assuming parameters are independent of one another). It is a useful tool for gauging how much room we have one dimension at a time before the project becomes value destructive. |
| Comparative statics | quantifies the sensitivity of the valuation to variation in a parameter holding fixed all other parameters. This implicitly assumes parameters are independent of one another. |
| Elasticity | of the valuation with respect to each parameter can help us compare the sensitivity of the valuation to different parameters.Elasticity = % Change in NPV / % Change in Parameter = ( ∆NPV / NPV ) / ( ∆P / P ) |
| Scenario analysis | quantifies the sensitivity of the valuation to variation in multiple parameters. |
| Simulation analysis | performs the valuation for a large number of simulated parameter values (i.e. scenarios). |
Return on Investment
The IRR rule leads to the same decision as the NPV rule as long as all negative cash flows precede all positive cash flows. NPV will not mislead in comparisons – the larger NPV, the greater the value. But:
- IRR can mislead when deciding among projects. Either small up-front cost or front-loaded cash flows will increase the IRR.
- IRR does not address difference in scale. 100% return on $1, or 10% return on $100,000, which is better?
My Certificate
For more on Corporate Finance, please refer to the wonderful course here https://www.coursera.org/learn/wharton-finance
I am Kesler Zhu, thank you for visiting my website. Check out more course reviews at https://KZHU.ai
Don't forget to sign up newsletter, don't miss any chance to learn.
Or share what you've learned with friends!
Tweet