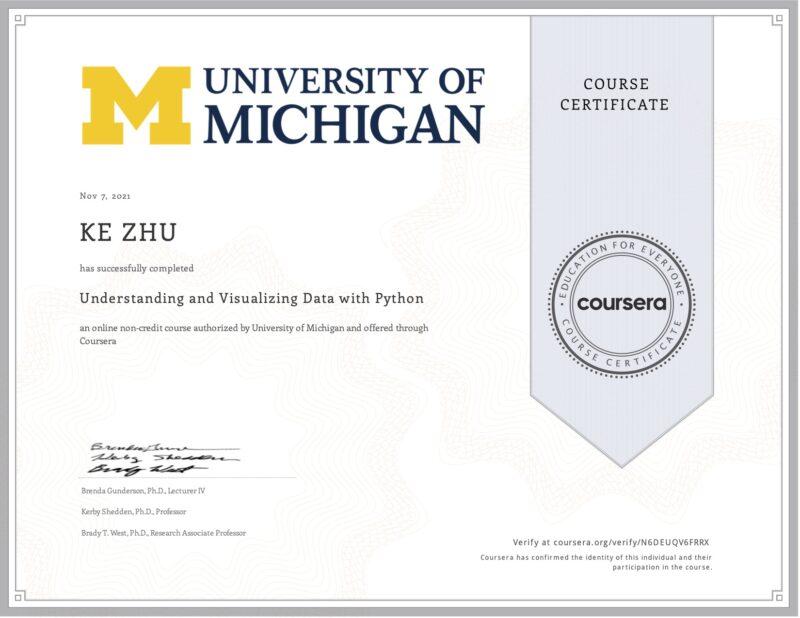
Understanding and Visualizing Data with Python
University of Michigan
This is a fantastic statistics course taught in the setting of Python programming language. It astonishes me that the professor did a cartwheel at the beginning, very impressive. The course mainly focus on the fundamentals of statistics. After the lecture of concepts, there are hands-on videos tutoring the use of statistical Python libraries. Very helpful.
The first 3 weeks is all about basics of univariate and multivariate data. The course taught techniques on how to analyze, understand, and visualize them, with concrete examples and sample Python code. It is worth being patient to watch all the videos.
The week 4 is huge and important. Apparently it only introduces population, sampling and the method how we collect data. But actually you will find you are touching “the root” of statistics science. The correct study design and proper method of data collection is so vital.
Wonderful is the lecture of inference for probability samples and non-probability samples. It reminds me the opinion that “Machine learning is just glorified statistics.” Do you agree? The point is these topics inspire students to find their own answer.
Quick Recap
My Certificate

https://coursera.org/share/fdac74a315c27a0ed9a433b60f6c04ba
Related Specialization
I am Kesler Zhu, thank you for visiting my website. Checkout more course reviews at https://KZHU.ai


